Skip to content

| “Quick AI-Powered Insights on the Topic— Freshly Updated!” ChatGPT Perplexity Google AI Mode |
Across multiple factory types such as automotive, food & beverage, pharmaceuticals, and general manufacturing, the frustration of hitting output targets can be felt by all companies. Why is it that output targets aren’t met when the headcount is full, when the shift reports from supervisors indicate that sufficient production has occurred for the shifts in question and large investments have been made into training, equipment, facilities, and supervision?
The answer is pretty simple. The most damaging factory floor productivity losses are not the ones that trigger alerts or appear in downtime logs. They are the ones that happen in the spaces between managed events, invisible to periodic walkthroughs, unrecorded in shift reports, and undetectable without continuous, floor-level visibility. This is termed the “hidden factory” by the manufacturing industry. The hidden factory represents the untapped capacity that exists in every plant but is never measured because the tools used to manage production were not designed to see it.
A study published on the OEE.com, indicates most manufacturers operate at about 60% of Overall Equipment Effectiveness (OEE), that is, approximately 40% of planned production time consumed by losses that are either unmeasured or mismeasured. In an analysis conducted by Jidoka in 2026, the average OEE for discrete manufacturers at 66.8%, with only 3% of plants reaching the world-class benchmark of 85%. The difference between the average factory and its potential is almost entirely attributable to loss and non-visibility of losses.
AI-powered computer vision provides a means to close this visibility gap. The following are five sources of hidden factory floor productivity losses that AI computer vision consistently uncovers.
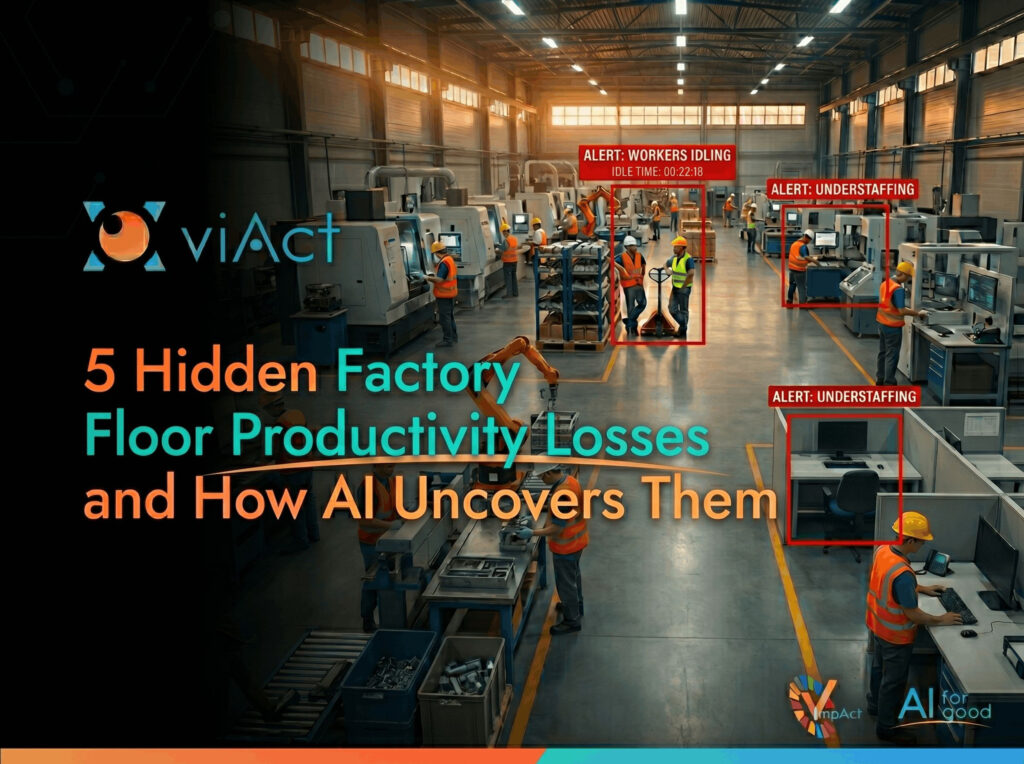
Loss 1: Idle Worker Time and Unauthorised Break Overruns

All manufacturing facilities have scheduled breaks. However, few know how much additional unplanned downtime accumulates across each shift. Workers spend time away from their assigned areas more than they use scheduled breaks, or wait at their locations without performing any action or gather in non-production areas, all of which create a cumulative productivity loss that goes unreported because no record exists of these occurrences.
The scale of the problem is what makes it so severe. When a single employee has an additional eight minutes away from their work station per shift, it is very insignificant. But now let’s do some maths! With 200 employees on an industrial production floor, with two shifts each day, that becomes thousands of minutes of lost production each day. Manufacturing operations that run on continuous lines, such as food & beverage or automotive assembly, experience a much greater impact to their throughput because they have no indication of where that production went because there is no measurement of this type of time loss.
In this regard, computer vision for factory productivity enables real-time comparison of employee presence against their designated zone schedules. No GPS or wearables are needed. By simply utilizing the existing CCTV infrastructure, it tracks worker zones, how long they have been in those zones, and if their presence aligns with the anticipated activity for the respective work station at that point in time. As soon as idle time or absence in a particular zone exceeds a pre-defined threshold, supervisors are notified immediately. When the pattern repeats across shifts, it surfaces as a trend that informs scheduling and deployment decisions rather than triggering individual reprimands.
Loss 2: Workforce Deployment Imbalance Across Zones
At most factories, workforce headcount is handled at the site level, that is, the floor supervisor knows how many employees are working at a particular shift, but they do not know where those employees are located within the plant relative to actual demand on a real-time basis.
This is a systematic inefficiency that has become commonplace and, therefore, normalized. There are some areas of the plant that have too many employees (overstaffing) but with no current work to do; while, there are bottleneck stations that have a few employees working (understaffing), which leads to delays in output. The shift report shows the attendance was full. Production targets were missed not because of absenteeism or equipment failure, but because the right people were not in the right places at the right time.
This is one of the most significant and invisible cause of productivity loss among manufacturing workforces, which occurs frequently in high-volume manufacturing settings. Automotive assembly lines, pharmaceutical production where operators must meet specific certifications, and food & beverage production where packaging and filling lines operate with varying capacities during a shift, are particularly susceptible to low productivity due to their reliance on large numbers of employees working within close proximity to one another.
Here, the use of a workforce heatmap enables operations managers to have a real-time view of the number of employees located at various points within their facilities. Each zone within the facility is color-coded based on the density of activity occurring within the zone. This enables the operations manager to view where workers are clustering, where are they working at a lower-than-average capacity as well as where there is little to no activity.
In addition to providing visibility, the system also tracks employee deployment patterns over time. This means, if a management team wants to determine if an employee deployment pattern is consistently and significantly correlated with decreased output, then they would have the necessary data to reassess it proactively.
Loss 3: Undetected Workflow Bottlenecks and Congestion Zones
On a factory floor, a bottleneck can be identified in two ways: by actually seeing work being stacked at a certain location or by missing a production target and doing an analysis after the shift to identify where it broke down. Both methods come too late because when supervisors see stacked work or reports come out after a shift, several hours of production have already gone down the drain.
What makes this loss particularly costly is that workflow bottlenecks are rarely caused by the same factor consistently. Sometimes it is a material flow issue and at other times it may be due to improper staffing or a process that operates at low throughput but breaks down when stressed. Without continuous visibility into activity density across every zone simultaneously, the pattern never becomes clear enough to be addressed systematically.
Computer vision allows mapping real-time activity levels throughout the factory floor as well as identify zones where work is accumulating faster than it is being processed. For example, in an electronics manufacturing facility, there may be a pileup at the inspection station, which is located between assembly and packaging. Similarly, in a general manufacturing facility, there may be a handoff point between shift A and shift B that generates a gap of 20 minutes in production flow, that compounds into an hour of lost output by the end of the day. The system does not require a missed target in order to flag an issue. It flags the pattern as it develops.
Loss 4: SOP Deviation and Process Sequence Non-Compliance
Standard Operating Procedures (SOPs) exist in factories for very specific purposes. In manufacturing, the order of tasks performed directly affects the cycle time, quality of output, and downstream efficiency. When workers skip steps, do things out of order, or take shortcuts under time pressure, the immediate effect is often not visible. But these effects may surface later as rework at a downstream station, as a quality rejection that no one can determine the source of, and as an imperceptible slowdown in cycle time, which results in lost output via incremental losses without triggering any sort of specific alert.
This is one of the most understated productivity losses in a factory as it occupies the grey area between safety compliance and operational performance. Most of the systems that monitor the performance of workers in factories are also implemented to identify safety violations. SOP deviation that does not create an immediate hazard goes entirely undetected. In both the pharmaceutical manufacturing facilities, where there is a clear relationship between process sequence and product integrity; as well as, the automobile assembly facilities, where the assembly sequence determines the quality of the assembled product, these invisible deviations from SOPs ultimately result in financial losses that are frequently accounted for against the wrong cause.
AI-powered systems are capable of detecting a series of expected physical actions at a particular station and notifying when there has been a deviation from that sequence, in real-time. This capability is not a broad stroke motion detection technology but instead is scenario-based AI, trained on the specific activity patterns relevant to a production environment. This is precisely why viAct’s approach of training on real industrial scenarios rather than generic datasets makes a material difference in detection accuracy. When a deviation is flagged, the supervisor receives a timestamped alert with supporting visual evidence, creating a record of corrective actions taken that connects process behaviour to downstream quality outcomes.
Real World Results
Despite using rigorous Good Manufacturing Practices (GMP), a top UK producer of sterile injectable drugs repeatedly faced the challenge of complying with SOPs. This included tailgating through the procedure involved in shift changes, unauthorized access to sterile zones, and unsafe crossover movements between chemical handling and sterile packaging lines, which both posed ongoing risks to contamination and the integrity of drug batches. Manual monitoring and paper-based access logs left critical gaps during peak operations. The manufacturer deployed viAct’s AI-powered access and movement monitoring modules with full on-premise deployment to protect sensitive production data.
The measurement and results of the implementation were as follows:
-
75% reduction in cross zone breaches in the first month after implementation
-
No reliance on paper-based access documentation through automated visual compliance records
-
Uninterrupted compliance with GMP during the highest-risk time for sterile zone breaches, a period of shift changes.
___________________________________________________________________________
Loss 5: Material Handling and Worker Movement Inefficiency
Production time is reduced every time a worker makes any unnecessary movement across the plant floor. The minute spent by a worker waiting for materials to arrive at their station is a minute of zero output. Such losses cannot be tracked because there are neither alerts for worker walking on inefficient route, nor downtime log entries for workers standing idle at a station waiting for a pallet, and no shift report field for movement inefficiency.
In automotive assembly plants or food and beverage processing facilities with many complicated layouts, inefficiencies caused by missed material handling and worker movement can consume an important portion of each productive worker’s shift. Although, the overall cumulative loss created through dozens of workers and hundreds of individual micro-events would be almost impossible to measure individually; but would collectively represent one of the most recoverable factory floor productivity losses available to any operations team because they are structural rather than behavioural. The fix is often simple and includes layout change, a routing adjustment, or a material staging improvement that requires no additional headcount or capital.
AI-powered worker movement pattern analysis tracks worker routing across the factory floor. It helps track how long it takes for the workers to get to a location, how much time it takes them to collect their materials, how long workers wait for materials and the areas of the factory with the most unproductive travel time. This data feeds directly into manufacturing workforce efficiency decisions around floor layout, material staging locations, and shift scheduling.
What AI Sees That Supervisors Cannot
All the above discussed productivity losses have an equal opportunity to be discovered as they occur. But neither a supervisor doing a floor walkthrough will catch them, nor will a shift report record them, nor an OEE dashboard built around equipment metrics will surface them. These losses are hidden not because they are rare, but because the majority of factories monitor their production workflows through an exception-based process, so they do not identify these losses as exceptions until they have multiplied to the point where production targets have been missed.
Factory productivity monitoring through computer vision works differently than traditional methods. It continuously monitors all areas of the factory or warehouse across all shifts without the negative consequences associated with human fatigue, or field of view limitations. Rather than waiting for an exception to occur for finding it, computer vision creates a record of the normal baseline for activities by creating an immediate record of the activity that deviates from the baseline level of performance. This is done according to the most relevant area.
The factories that have been successful in closing the gap between their actual OEE and their potential OEE are not necessarily the ones having more sophisticated manufacturing equipment. But they are the ones that have successfully revealed the hidden losses into visible ones, and that starts with understanding which losses were never being measured in the first place.
Conclusion: Key Takeaways
The loss of factory floor productivity unfolds in the shadows. As they gather momentum over time, across different shifts, zones and workflows, gaps between planned output vs. actual output rates eventually exceed the ability for conventional reporting methods to account for them.
-
When workers spend unscheduled time away from their assigned zones, productivity is lost without anyone being notified. A computer vision system, like viAct, however, can report on worker presence in real-time compared to their zone schedule, thereby identifying idle time patterns before they grow into shift loss trends.
-
Having too many workers in low demand locations while having too few workers at choke points results in an inefficient structure even though headcount reports appear to be accurate. AI-powered workforce heatmaps portray the real-time distribution of workers across the factory floor allowing for immediate re-deployment of workers before output is adversely affected.
-
Work accumulates at hand-off points and/or heavily congested areas prior to missing production targets, making detection of the bottleneck and its corresponding production loss impossible until the loss has already occurred. A computer vision system monitors the density of activity across all zones of the factory floor simultaneously; therefore, providing access to data concerning how and where accumulations are occurring in real-time so that they can be addressed before any resulting damage has occurred.
-
Non-compliance with the steps in a SOP, or carrying out the work out of order can cause rework downstream and affect quality negatively in a manner that is frequently recorded incorrectly. AI identifies deviations from the proper sequence in each task as they occur in real-time and maintains a record of that task as well as the resultant outcome.
-
Excessive travel, waiting for materials that were not received or transported in the expected time consume valuable production time. Analysis of movement patterns using AI, documents the actual travels taken compared with the best possible path for each worker, thereby identifying locations that would provide the greatest benefits from layout or material staging changes.
The average manufacturer operates between 60-67% OEE. The distance between that figure and world-class performance sits almost entirely in losses that were never made visible. These factory floor productivity losses are recoverable. But only once they are found.
1. What other factory floor productivity losses does viAct AI detect?
In addition to the five productivity losses discussed in the blog above, viAct can also identify micro-stoppages at the equipment level that are less than two minutes in duration and not recorded as formal downtime events, but when combined, they take away from the total production time during a shift. viAct AI can also notice when machinery is idling during unscheduled down times and can flag the same housekeeping issues that cause obstructions to workers movement and slow down the material flow. All of these occurrences do not appear in a normal shift report, but viAct’s AI can identify them through continuous monitoring of the floor for a production facility.
2. How does viAct identify productivity losses on a factory floor without disrupting operations?
By using RTSP, viAct integrates with the existing CCTV network as opposed to requiring new physical equipment installation or affecting current operations. Once connected, AI modules analyse live video feeds to detect zone activity, worker movement patterns, and workflow deviations in real-time. The system runs in the background continuously, generating insights through the viHUB dashboard without requiring operators or supervisors to change how they work.
3. Can viAct’s computer vision detect productivity losses across multiple shifts and compare performance between them?
Yes. viAct’s Enterprise Centralized Management Platform (ECMP) aggregates data across shifts, allowing operations managers to compare zone activity levels, idle time patterns, workflow congestion frequency, and movement efficiency between day and night shifts. This cross-shift visibility is particularly valuable because many hidden productivity losses are shift-specific, caused by crew composition, supervision coverage, or material staging routines that vary between shifts but are never directly compared.
4. How does viAct protect worker privacy while monitoring factory floor productivity?
viAct follows a privacy-by-design approach. The system uses activity tracking rather than individual identification, meaning productivity insights are generated at the zone and pattern level without storing personally identifiable visual data. Face masking is applied by default, and all video processing can be done locally via edge AI devices, ensuring that sensitive operational footage never leaves the facility. This makes the system compliant with GDPR and regional data protection requirements across viAct’s key markets including Singapore, Hong Kong, and the GCC.
5. Where is viAct’s factory floor productivity monitoring solution operational?
viAct AI-powered industrial workforce productivity monitoring solution is operational across key manufacturing markets including Singapore, Hong Kong, Saudi Arabia, the UAE, Qatar, Australia, and Malaysia. It has been deployed across a range of factory environments including automotive and EV manufacturing, food and beverage production, general manufacturing, and industrial facilities. The platform is built for multi-site deployment, allowing operations teams managing facilities across different geographies to monitor productivity from viHUB – a single centralised dashboard.
viAct is a leading Impact AI company focused on improving safety and efficiency in high-risk industries. Since 2016, we’ve implemented innovative “Scenario-based Vision Intelligence” solutions across hundreds of organizations. Recognized by Forbes and the World Economic Forum, we aim for a sustainable future through responsible technology.