Bridge inclination by the surcharge load and rectification by the unloading
In the calculation, the inclination of the super and lower structures of the bridge under the action of the surcharge load was first analyzed to evaluate whether the pile foundation in the underground soil was damaged, and which was used to provide a reference for structural maintenance or reinforcement in the next step. Then the effect of the unloading rectification was predicted, for the possible rectification by external forces.
It was because the original inclination of piers and the opening width of expansion joints were unknown, the exact values of the changes in the pier inclination and joint opening widths caused by the deposited soil could not be obtained. The pier inclination and the joint opening width before and after the unloading of the deposited soil were measured, however, so the recovery of the piers and expansion joints after unloading could be obtained to verify the reliability of the numerical calculations.
The condition of loading and unloading of surcharge load
The conditions of the bridge before loading, during loading, and after unloading are shown in Fig. 12. When the accident was found on May 30, 2017, the average height of the earth heap was about 3 m, the highest was about 6 m, and the area was about 17,000 m2. Unloading was carried out from June 1 to June 10, 2017, and the unloaded earth was about 7000 m3. The regular measurement of piers and expansion joints was done from June 1, 2017 to March 2018 when the rectification was finished.
The working conditions: (a) before loading; (b) during loading; (c) after unloading; (d) FEM model before loading; (e) FEM model during loading; (f) FEM model after unloading.
Using the model and method proposed in this study, the deformation and stress of the bridge structure and the foundation during the loading and unloading processes were calculated. It is because the bridge is located in a soft soil area, the deposited earth will cause elastoplastic deformation and drainage consolidation of the underground soil. Drainage consolidation is a time-dependent process, and therefore the structural deformation is also a time-dependent process. In the calculation, it was necessary to determine the times of loading and unloading of the deposited earth.
Yet, it was not possible to find out when the earth was deposited. Therefore, another method was used to speculate this start time. First, the degree of soil consolidation was determined by the change of pier inclination during the unloading. Then, through the simulation of soil consolidation under the surcharge load, the loading time was speculated, and the starting time when the earth was deposited was determined. By using this method, the loading time of the deposited earth was inferred to be from March 13, 2017 to April 2, 2017, and it was assumed linearly increased from zero to the maximum value. Then this surcharge lasted for about 2 months until it was found and unloaded.
Calculation results
Pier inclination
The calculated pier inclinations under the surcharge load are shown in Fig. 13. It indicates that all the piers are inclined towards the surcharge load, which is overall consistent with the measurements. The comparison between the calculations and the measurements of the typical pier inclinations are listed in Table 8, and the calculated and measured inclinations of piers have some differences. The reasons for this difference are as follows: (1) the initial inclination of the piers was assumed to be zero in the calculation, while that of less than 3 ‰ was allowed, and may exist in the actual bridge; (2) the magnitude and loading time of the surcharge in calculation may be different from those in practice; (3) the properties of soil in the calculations may be different from those of actual soil, such as whether it is completely saturated.
The inclination of the piers and piles under surcharge load (the deformation is magnified 50 times): (a) all the piers; (b) pier 22 along the bridge span; (c) pier 22 perpendicular to the bridge span (unit: m).
After the unloading, the calculated inclinations of typical piers are listed in Table 9, in which the results are overall consistent with the measurements. The inclination of the piers got reduced after the unloading, but some of these could not be restored to less than 3 ‰ as required by the standard25.
The history of the inclination of typical piers during and after unloading is shown in Fig. 14. It indicates that the numerical simulation can predict quite well the variation of the pier inclination. Therefore, on this basis, the initial inclination of the pier can also be speculated based on the numerical simulation. The accuracy of the calculated inclination of pier 22 is better than that of pier 37 due to the difference between the actual surcharge load and the assumed one in the FEM model, and the earth heap near pier 37 in the accident were less known.

θy of typical piers when the initial inclination was assumed to be 0: (a) pier 22; (b) pier 37.
The opening width of the expansion joint
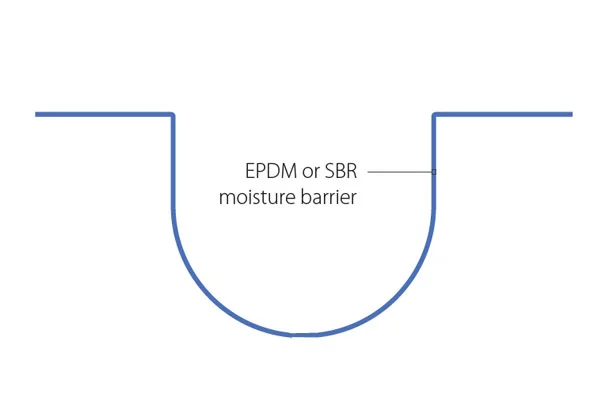
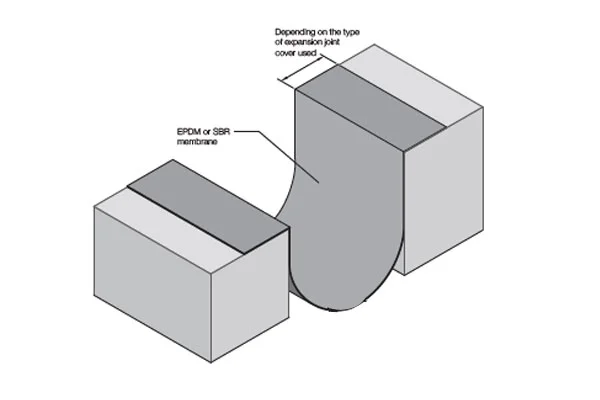
The calculated variation of the opening width of typical bridge expansion joint is shown in Fig. 15. As shown in Fig. 15a, b, when the bridge structures are under the surcharge load, the deformation of girder 1 and girder 2 is opposite, which causes the opening width of the expansion joint, w, to become larger. As shown in Fig. 15c, after the earth heap is unloaded, the deformation of the girders is partially recovered, and the opening width of the expansion joint, w, becomes smaller.
The variation of the opening width of the expansion joint above pier 22 (deformation is magnified 10 times) (a) the deformation of the girders and piers beside under surcharge load; (b) opening width of the expanson joint under surcharge load; (c) partial recovery of the opening width of expanson joint after unloading (unit: m).
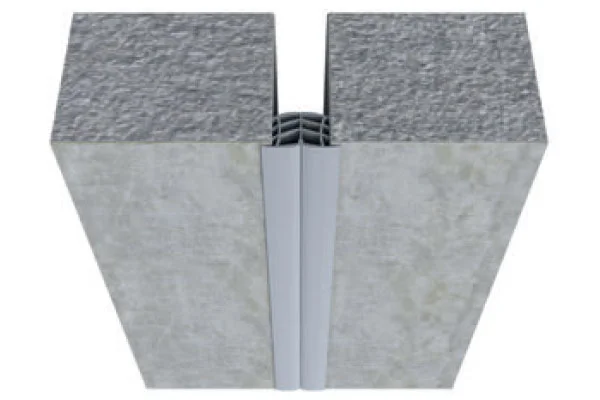
The practical measurements also show that the loading and unloading of the surcharge have significant impacts on the opening width of some expansion joints on the ramp bridge. As shown in Fig. 16, after unloading, the opening width of the expansion joint above pier 22 decreased gradually by about 10 mm, and that above pier 29 increased gradually by about 18 mm.
The opening width of the expansion joints: (a) above pier 22 before unloading; (b) above pier 22 after unloading; (c) above pier 29 before unloading; (d) above pier 29 after unloading.
In order to compare the calculated result with the measurement, it is assumed that the initial expansion joint width from the calculation is same as that from measurement at the beginning of the earth heap unloading. The changes in the opening width of the expansion joints above pier 22 and pier 29 are shown in Fig. 17, which occurred within 12 days after the start of unloading. These results indicate that the change of the opening width of the expansion joint was predicted well by numerical simulation, and the maximum difference between the calculation and measurement was less than 5%. The calculation results also show that the surcharge loading was the main reason for the change of the opening width of the expansion joints. Further, the service performance of the expansion joints on the bridge deck can be used as an important indicator for the service performance of the bridge under the action of the adjacent surcharge load, and this indicator was easier to find because it is on the bridge deck.
The variations in the opening width of the expansion joints in the process of unloading: (a) the expansion joint above pier 22; (b) the expansion joint above pier 29.
Stress of the pile foundation
Due to the existence of expansion joints and elastic bearings, the movement of the bridge girder is relatively free, so the stress in the girder caused by the inclination of the pier is small, and the deformation can be measured. For the substructure, however, especially the pile foundation embedded in the soil layers, directly bears the earth pressure and is most affected by the surcharge load. Furthermore, the deformation and stress of the pile were difficult to be measured, so it was necessary to obtain the response of pile foundation under the surcharge load through theoretical analysis to judge whether it was damaged.
In order to simulate the pile-soil interaction accurately, a 3D solid element was used to simulate the pile structure. Also, the meshes of pile were refined to obtain the deformation and stress distribution accurately. Figure 18 shows the lateral deflection of pile 22 under the surcharge load, which is consistent with that of in previous studies23,24.
The lateral deflection of pile 22.
In general, the main failure of the concrete pile, under the influence of lateral earth pressure, is bending cracking, and thus it is necessary to calculate the stress in the pile. The calculated principal tensile stress of a typical pile beneath pier 22 is shown in Fig. 19. The calculations indicate that the underground pile was subjected to lateral earth pressure under the action of ground surcharge load, and the maximum principal tensile pressure was located at the top of the pile (Fig. 19b). The maximum tensile stresses in the piles of the ramp bridge are shown in Table 10. These stresses do not exceed the flexural-tensile strength of C25 concrete (4 MPa) used in the current bridge pile, and thus so it will not crack under the influence of surcharge beside the bridge.
Tensile stress in pile 22: (a) the distribution of tensile stress in the pile; (b) the maximum tensile stress.
Parametric analysis of loading and unloading condition
In the parametric analysis, the main factors, affecting the inclination and recovery of bridge structures, are the soil properties, and the duration and magnitude of the surcharge load, which are discussed in the following.
The effect of soil properties
In order to study the influence of soil properties on the inclination and recovery of the pier, soil layers with different properties can be selected for analysis34. As shown in Table 11, three types of soil layers with different hardness were selected in the present study.
The load in numerical simulation was similar to the practical loading and unloading of the deposited earth beside the bridge, that is to say, the surcharge load was increased from 0 to the maximum in 20 days, then maintain for 60 days, and then was removed in 10 days. Figure 20 shows the history of the inclination of pier 22 with this load in which the three types of soil layers (Table 11) were adopted, respectively. The results showed that higher the hardness and the lower the water content were of the foundation soil, the smaller was the inclination of the pier caused by the adjacent surcharge load, and higher was also the proportion of recovery after unloading. The reduction ratio of the pier inclination after unloading is 40.05%, 43.48%, and 53.4% for soil layers of type 1, type 2 and type 3, respectively. Therefore, when the soil layer was hard and the water content was low in the actual case, the inclination of the pier may have been reduced below the value allowed by the specification after unloading. Otherwise, further rectifications by external force should be carried out after unloading.
The inclination of pier 22 for the different soil layers.
The effect of loading time
In order to study the influence of loading time on the inclination and recovery of the piers, three different loading durations, namely 20, 40, and 60 days, were selected for the numerical simulations, and the results are shown in Fig. 21. The drainage consolidation of foundation soil is not immediately completed after the applying of earth heap. The drainage consolidation of soil is a long process, and the inclination of the pile slowly increases until it reaches stability35. In this process, the drainage consolidation of foundation soil did not reach a stable state, so the longer the loading time, the more serious was the drainage consolidation of the foundation soil, and greater was the inclination of the pier.
The inclination and recovery of the pier in different loading time.
The recovery ratio of the pier inclination after unloading is shown in Table 12: with the increase of loading time, the recovery ratio decreases. Therefore, when the loading time was too long, the inclination of the pier, after the unloading, may not be able to recover to the acceptable value, and that further rectification might be needed.
The effect of the surcharge magnitude
A previous study found that the surcharge strength was an important factor affecting the behavior of adjacent piles in soft soils (Hongquan, 2019). Therefore, three earth heaps with the height of 3 m, 4 m, and 5 m were modeled to investigate the effect of surcharge magnitude on the inclination of pier 22, and the results are shown in Fig. 22. It can be seen that the inclination of the pier increased with the increase of the loading strength. The recovery ratio of the pier inclination, after the unloading, is shown in Table 13. These results indicate that larger was the surcharge load, the smaller was the deformation that could be recovered after unloading.
The inclination and recovery of the pier with different surcharge magnitude.
Lateral pushing rectification of the girder and pier
Lateral pushing rectification of the girder
The FEM model of lateral pushing of the bridge girder 1 is shown in Fig. 23. Because the opening width of the expansion joint on pier 22 is 16.5 cm after unloading, which exceeds the acceptable value of type 160 expansion joint, a lateral force was applied on the girder 1 above pier 18 to move it towards pier 22 to reduce the opening width of expansion joint above pier 22 (Fig. 23).
The finite element model of the lateral pushing of the girder.
The comparison between the calculations and measurements of the lateral pushing process of the girder is shown in Fig. 24, in which the results reflect the relationship between displacement and the pushing force during the girder rectification.
Movement of the girder in the lateral pushing rectification.
It is because the girder is consolidated with pier 20, its displacement will cause the bending of the pier 20 the piles below. Therefore, it was deemed necessary to predict the tensile stress of piers and piles caused by such bending to prevent cracking damage. Figure 25 shows the calculated tensile stress in the pile foundations. The maximum tensile stress, 1.023 MPa, located at the pile below pier 20, is less than the tensile strength of concrete C25 used for the pile, 1.27 MPa. Therefore, this suggests that the substructure will not be damaged during jack pushing.
The maximum tensile stress of piles below girder 1 of the bridge.
Lateral pushing rectification of the pier
After the girder pushing was completed, the pier with the inclination along the span which exceeded 3 ‰ was rectified, such as pier 22 in Fig. 26a. Using the reaction force provided by the main girder, the top of the pier was pushed to reduce the inclination to an acceptable value. In this process, a Teflon sliding plate was placed between the pier and the girder, so that the friction between the girder and the pier was very small, and can be ignored. Figure 26b shows that the excavation of the stress dissipation hole relieve the lateral pressure of the soil in the FEM model.
The FEM model of lateral pushing of the pier: (a) the whole model; (b) the pier and the stress dissipation hole.
The relationship between the displacement and pushing load on the top of the pier is shown in Fig. 27, and it indicates that the numerical results can be used to predict the pushing force required for the pier rectification. When the pushing force is less than 120 kN, it has a linear relationship with the displacement, which indicates that the overall structure composed of pier, pile foundation and soil is in a linear elastic state. When the pushing force is greater than 120 kN, the elastoplastic deformation occurs in the soil, so the slope of the relationship curve between the pushing force and displacement becomes smaller and fluctuates.
The displacement at the top of pier 22 in the lateral pushing rectification.
It was because that the top of pier 22 was pushed, the pier and the pile foundation below will bend. Therefore, on this basis, it is necessary to prevent the tensile stress in the pile from exceeding the allowable value, which might result in cracking damage. Figure 28 shows the calculated tensile stress of the pile foundation under pier 22. The maximum tensile stress, 1.218 MPa, at the top of the pile, is less than the tensile strength of concrete C25 used for the pile, 1.27 MPa. Therefore, on this basis, it can be concluded that the pile will not be damaged during the pushing.
The maximum tensile stress in the piles below pier 22.